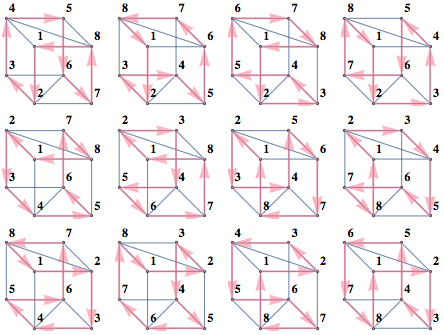
Here are the 12 cycles produced this way for BislitCube

Here are the constraints that were used
- Every vertex has one incoming and one outgoing edge
- Cycles of length 2 are forbidden
- Every vertex is assigned one number
- First vertex is assigned number 1
- Presence of edge i,j implies number of number(j)=number(i)+1 and the converse
Smaller number of constraints can be used, but I found that increasing constraints makes SAT solver faster.
For these Graph Theory -> SAT encoding tasks, I find it helpful to have "formula"/ "vars" variables, and "decodeInstance"/"drawInstance" functions that so I can do something like this
sats = SatisfiabilityInstances[formula, vars, 20];
drawInstance /@ sats
decodeInstance /@ sats
decodeInstance turns variable assignment into readable/easy to process format, whereas drawInstance visualizes the instance as in pictures above.
Below is the notebook used to generate this diagram. It also has a helper .m file to draw a grid of all graphs with given set of properties. For instance, to show all graphs in GraphData that have 12 vertices, are Planar, Connected but are not Trees and fit in a 6x6 grid you would do
Needs["Bulatov`showGraphs`"];
showGraphs[12, "Connected", ! "Tree", "Planar", gridSize -> 6]

Name of graph shows up in Tooltip
 Notebook+package
No comments:
Post a Comment