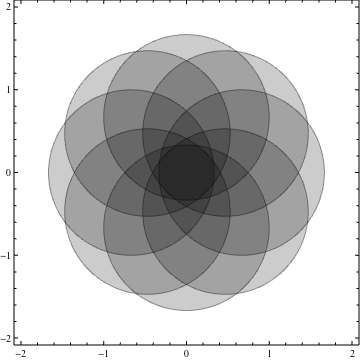
nc = 8;
ineqs = Table[(x - 2/3 Cos[i 2 Pi/nc])^2 + (y -
        2/3 Sin[i 2 Pi/nc])^2 < 1, {i, 0, nc - 1}];
Show[Table[
  RegionPlot[ineqs[[k]], {x, -2, 2}, {y, -2, 2}, PlotPoints -> 35,
   PlotStyle -> Opacity[.2]], {k, 1, nc}]]
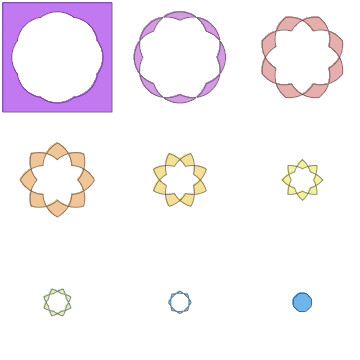
What if we want to color overlapping regions according to how many overlaps they had?
We can use "BooleanCountingFunction" as follows
plots = Table[
RegionPlot[
BooleanCountingFunction[{k}, ineqs], {x, -2, 2}, {y, -2, 2},
PlotPoints -> 100, Frame -> None,
PlotStyle -> ColorData["Pastel"][k/nc]], {k, 0, nc}];
GraphicsGrid@Partition[plots, 3]
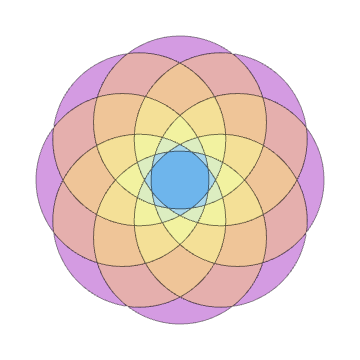
Show[Rest[plots]]
Its a great posting. Thank you for sharing with us.
ReplyDeleteMathematica