I put together the code that takes care of rotations into "simplexPlot" and also used a recipe from math.SE for traditional 3D axes. Below is simplex plot of Sin[x y z]
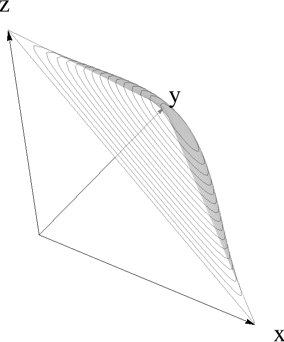
The function "simplexPlot" in notebook plots the function in x-y plane. Function "axes" does traditional 3d axes. To visualize the connection to the original simplex domain, I rotate the whole plot back into original domain
t = AffineTransform[{{{-(1/Sqrt[2]), -(1/Sqrt[6]),
      1/Sqrt[3]}, {1/Sqrt[2], -(1/Sqrt[6]), 1/Sqrt[3]}, {0, Sqrt[2/3],
       1/Sqrt[3]}}, {1/3, 1/3, 1/3}}];
graphics = simplexPlot[5 Sin[#1 #2 #3] &, Plot3D];
shape = Cases[graphics, _GraphicsComplex];
gr = Graphics3D[{Opacity[.5], GeometricTransformation[shape, t]},
   Axes -> False, Boxed -> False, Lighting -> "Neutral"];
Show[gr, axes[1, 1, 1, 0.05, 0.02]]
Notebook
Thank you for sharing with us.
ReplyDeleteMathematica