Monday, January 30, 2012
Mathematica Stack Exchange launched
After more than a year, the proposal for separate Mathematica stack exchange platform has been approved, and the site has been launched.
http://mathematica.stackexchange.com/
So far it seems quite active, and I was able to get my question answered within minutes.
Visualizing SDP cone
One way to visualize cone of positive semi-definite matrices is to take random 2D sections of the cone. Example is below, from images it's clear this region is non-smooth
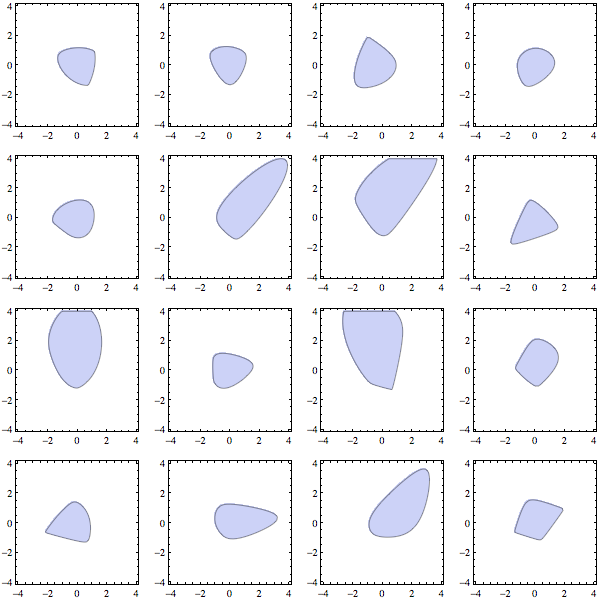
It doesn't look as instructive in 3D, but for example of doing the same in 3D, see this Mathematica stackexchange post
spectro13 := (
  X = ( {
     {x1, x2, x3, x7},
     {x2, x4, x5, x8},
     {x3, x5, x6, x9},
     {x7, x8, x9, x10}
    } );
  vars = Union@Flatten@X;
  dvars = {x, y};
  m = Length@vars;
  n = Length@dvars;
  makeMat := X /. (Thread[vars -> #]) &;
  proj = makeMat /@ Orthogonalize@RandomReal[{-1, 1}, {n, m}];
  mat2 = Total@MapThread[Times, {proj, dvars}, 1] +
    IdentityMatrix@Length@X;
  cons = And @@ (Thread[Eigenvalues[mat2] >= 0]);
  RegionPlot[cons, {x, -4, 4}, {y, -4, 4}, PlotPoints -> 15]
  );
GraphicsGrid[Table[spectro13, {3}, {3}], ImageSize -> 600]
It doesn't look as instructive in 3D, but for example of doing the same in 3D, see this Mathematica stackexchange post
Subscribe to:
Comments (Atom)